Data-Driven Event Planning Strategies
Data-Driven Event Planning Strategies – Make Smarter Event Decisions & Improve ROI
Data-Driven Event Planning Strategies
Data-driven event planning strategies enable organizations to plan corporate conferences, exhibitions, AGMs, product launches, workshops, summits, networking events, trade shows, executive meetings, and MICE events using measurable information rather than assumptions alone. Modern events generate valuable data throughout the entire event lifecycle, from marketing and registration to attendance, session participation, audience engagement, networking, sponsorship interactions, lead generation, livestreaming, surveys, and post-event content consumption. When collected and interpreted effectively, this information can provide organizers with a clearer understanding of what audiences value and how successfully an event achieved its objectives.
Event data can support better decisions about venues, budgets, event formats, speakers, agendas, catering, marketing, audiovisual production, staffing, and delegate experiences. Registration trends can help estimate attendance and resource requirements, session participation can reveal which topics generate the strongest interest, engagement data can show how audiences interact with presentations, and sponsorship or lead-generation metrics can help demonstrate commercial value. However, successful data-driven planning starts with clearly defined objectives and relevant key performance indicators (KPIs), supported by reliable data collection, appropriate event technology, responsible data management, and structured post-event analysis. The goal is not simply to collect more information, but to turn useful event data into practical decisions and measurable improvements.
Peak Audio supports modern data-driven corporate events in Kenya with professional audiovisual production and event technology solutions. From professional sound systems, LED screens, staging, and lighting to simultaneous interpretation, livestreaming, hybrid event technology, multi-camera video production, recording, and technical support, Peak Audio helps organizations build the technical environments required for engaging and measurable event experiences. This guide explores how organizers can use event data before, during, and after an event to improve planning, understand audience behaviour, demonstrate value to stakeholders and sponsors, optimize future events, and achieve stronger returns on event investment.
1. What Is Data-Driven Event Planning?

Data-Driven Event Planning Strategies
Data-driven event planning is an approach to organizing corporate conferences, exhibitions, AGMs, product launches, workshops, summits, networking events, trade shows, executive meetings, and MICE events using relevant information and measurable evidence to support decisions rather than relying primarily on assumptions. Data can be collected before, during, and after an event to improve decisions involving venues, budgets, marketing, agendas, speakers, catering, audiovisual production, staffing, delegate experiences, sponsorship, and future event strategy.
1.1 Using Data Instead of Assumptions
Event organizers regularly make decisions about attendance, venue capacity, catering, programme design, marketing, technical production, staffing, and budgets. Historical and current event information can provide stronger evidence for these decisions than assumptions alone.
- Historical Attendance Data – Previous registration and attendance records can help estimate likely delegate numbers for future events.
- Registration Trends – Monitoring how quickly people register can help organizers understand demand and adjust marketing activities.
- Session Attendance – Previous session participation can indicate which topics, speakers, or formats attracted stronger interest.
- Catering Information – Historical attendance and consumption patterns can support more accurate food and beverage planning.
- Marketing Performance – Email, social media, advertising, website, and registration data can show which channels generated registrations.
- Delegate Feedback – Previous surveys can identify recurring concerns, preferences, and opportunities for improvement.
- Budget Information – Historical expenditure can help planners develop more realistic budgets and identify major cost areas.
- Operational Records – Information about queues, transport, registration, technical incidents, room capacity, and staffing can improve future logistics.
- Current Event Data – New registration and engagement information can be compared with historical patterns as planning progresses.
Using data instead of assumptions helps organizers make more informed decisions about attendance, venues, catering, marketing, budgets, programme design, staffing, logistics, and technical production.
1.2 Establishing Clear Event Objectives
Data becomes useful when organizers first define what the event is intended to achieve. Different objectives require different measurements, so a conference designed for lead generation should not necessarily be evaluated in the same way as an employee training programme or industry summit.
- Lead Generation – An exhibition, conference, or product event may aim to generate qualified prospects for sales teams.
- Delegate Education – Training events and professional conferences may focus on knowledge transfer and learning outcomes.
- Relationship Building – Networking events can prioritize meaningful connections between delegates, partners, clients, and industry professionals.
- Brand Awareness – Organizations may use events to increase visibility among specific audiences or industries.
- Product Launches – Launch events can focus on product demonstrations, media attention, customer interest, and sales opportunities.
- Employee Engagement – Internal events may focus on participation, communication, collaboration, recognition, or organizational alignment.
- Sponsor Value – Conferences and exhibitions may aim to provide measurable visibility, interactions, leads, or engagement for sponsors.
- Customer Engagement – Events can strengthen relationships with existing customers through education, networking, demonstrations, and direct interaction.
- Business Development – Executive meetings, summits, and industry events may support partnerships, investment discussions, or new commercial opportunities.
Clear objectives establish what success means for the event and provide the foundation for selecting meaningful KPIs, collecting relevant data, and evaluating outcomes.
1.3 Identifying Relevant Event KPIs
Key performance indicators should directly relate to the event’s objectives. Collecting large quantities of information is not automatically useful if the measurements do not help organizers understand whether the event achieved its intended outcomes.
- Registration Numbers – Measure the number of people who registered for the event.
- Attendance Rate – Compare actual attendance with confirmed registrations.
- Session Participation – Track attendance or participation across individual sessions where appropriate.
- Audience Engagement – Monitor questions, polls, surveys, downloads, digital interactions, or other relevant activities.
- Lead Generation – Track qualified prospects generated through exhibitions, meetings, demonstrations, or networking.
- Networking Activity – Measure meetings, introductions, contacts, or platform interactions where suitable systems are available.
- Sponsor Engagement – Review sponsor booth visits, content interactions, lead capture, or other agreed measurements.
- Delegate Satisfaction – Use surveys and feedback to understand participant experiences.
- Content Engagement – Monitor views, downloads, livestream audiences, recordings, or other digital content interactions.
- Business Outcomes – Where appropriate, examine sales opportunities, partnerships, conversions, renewals, or other outcomes linked to the event.
Effective KPIs should connect directly to event objectives and decision-making needs, helping organizers focus on measurements that provide meaningful evidence rather than collecting data simply because it is available.
1.4 Collecting Pre-Event Data
Pre-event data can help organizers understand who is likely to attend, what delegates expect, which marketing activities are working, and what operational resources may be required.
- Registration Information – Collect relevant details such as names, organizations, job roles, industries, and attendance preferences.
- Delegate Demographics – Appropriate demographic or professional information can help organizers understand the composition of the audience.
- Marketing Data – Track registrations generated through email, social media, advertising, partners, websites, or other campaigns.
- Registration Timing – Monitor when registrations occur to understand demand and campaign performance.
- Session Preferences – Allow delegates to indicate preferred workshops, breakout sessions, or programme topics where appropriate.
- Dietary Requirements – Collect information needed for accurate catering preparation.
- Accessibility Requirements – Provide appropriate channels for delegates to communicate support requirements.
- Previous Attendance – Identify returning delegates and review historical participation patterns.
- Pre-Event Surveys – Ask attendees about expectations, interests, knowledge levels, or topics they would like addressed.
- Travel Information – For appropriate events, delegate arrival and accommodation information can support transport and logistics planning.
Pre-event data can inform audience profiling, marketing, programme design, catering, accessibility, transportation, venue planning, staffing, and technical requirements before delegates arrive.
1.5 Collecting Live Event Data
Once an event begins, live information can help organizers understand what is happening rather than waiting until the programme has ended. Depending on the technology available, some data can support real-time operational adjustments.
- Check-In Data – Digital registration systems can show how many registered delegates actually arrived.
- Session Attendance – Appropriate systems can help identify which sessions attract stronger or weaker participation.
- Live Polling – Poll responses can provide immediate information about audience opinions, knowledge, or preferences.
- Audience Questions – Q&A platforms can show which issues or topics generate the greatest interest.
- Digital Engagement – Event apps, QR codes, websites, and other platforms can provide information about delegate interactions.
- Networking Activity – Suitable event platforms can record meeting requests, introductions, or other networking activity.
- Exhibitor Engagement – Lead capture or scanning systems can provide information about interactions with exhibitors.
- Livestream Engagement – Online attendance, viewing duration, questions, and other relevant interactions can help assess remote participation.
- Operational Information – Registration queues, catering demand, room occupancy, transport, and technical issues can provide useful operational insights.
Live event data can provide immediate insight into attendance, session popularity, audience participation, networking, exhibitor activity, digital engagement, livestreaming, and operational performance.
1.6 Analyzing Post-Event Data
Post-event analysis brings together information collected across the entire event lifecycle. Rather than judging success based only on attendance or general impressions, organizers can compare actual results with the objectives and KPIs established before the event.
- Attendance Analysis – Compare registrations, confirmations, actual attendance, and no-show rates.
- Session Performance – Review which presentations, workshops, panels, or breakout sessions attracted participation.
- Delegate Surveys – Analyze satisfaction, recommendations, complaints, and suggestions for improvement.
- Lead Analysis – Review the quantity and quality of leads generated through exhibitions, networking, meetings, or product demonstrations.
- Content Performance – Measure livestream views, recording views, downloads, presentation access, and other digital engagement where available.
- Marketing Performance – Determine which channels generated registrations, engagement, or other desired actions.
- Sponsor Performance – Review agreed indicators relating to sponsor exposure, interactions, leads, or content engagement.
- Operational Performance – Examine registration, catering, transport, venue utilization, staffing, and technical production.
- Budget Performance – Compare planned and actual expenditure and assess major variances.
- Business Outcomes – Where reliable attribution is possible, connect event activity with sales opportunities, partnerships, customer relationships, or other organizational objectives.
- Lessons for Future Events – Convert findings into practical recommendations for the next event.
Post-event analysis helps determine what happened, what performed well, what underperformed, why certain outcomes occurred, and what should change for future events.
Data-driven event planning connects objectives, measurable KPIs, attendee information, engagement data, operational performance, and post-event analysis to improve decision-making throughout the event lifecycle.
The process begins by defining what the event is intended to achieve and then identifying the information required to measure those objectives. Pre-event data can improve forecasting and planning, live data can reveal participation and operational patterns as the event happens, and post-event analysis can evaluate performance and identify lessons for future events.
The objective is not to collect as much information as possible. Effective data-driven event planning focuses on relevant, reliable, responsibly collected information that supports specific decisions. When used effectively, event data can help organizers improve delegate experiences, allocate budgets more effectively, strengthen marketing, refine programmes, demonstrate sponsor value, improve technical and operational planning, and make future corporate events more measurable.
2. Important Event Data to Collect

Data-Driven Event Planning Strategies
Effective data-driven event planning depends on collecting information that directly supports planning, decision-making, performance measurement, and future improvement. For corporate conferences, exhibitions, AGMs, product launches, workshops, summits, networking events, trade shows, executive meetings, and MICE events, useful data can come from registration systems, websites, marketing platforms, check-in tools, event apps, surveys, livestreaming platforms, networking systems, sponsors, exhibitors, and operational records.
Organizers should focus on information that serves a defined purpose and manage attendee information responsibly, with appropriate attention to privacy, consent, access, security, and applicable data-protection requirements.
2.1 Registration Data
Registration data provides some of the earliest measurable information about an event. It can help organizers understand demand, audience composition, marketing effectiveness, registration patterns, and operational requirements before the event begins.
- Number of Registrations – Track total registrations and compare them with attendance targets or venue capacity.
- Registration Sources – Identify whether delegates arrived through email campaigns, social media, advertising, partners, search engines, direct website visits, referrals, or other channels.
- Delegate Categories – Separate attendees into useful groups such as customers, prospects, employees, partners, sponsors, exhibitors, media, speakers, VIPs, or industry professionals.
- Registration Timing – Monitor when registrations occur to understand whether delegates register early, close to the deadline, or after particular marketing campaigns.
- Registration Growth – Compare registration numbers over time to identify periods of stronger or weaker demand.
- Ticket or Pass Types – Where applicable, track standard, VIP, exhibitor, speaker, sponsor, virtual, or other registration categories.
- Incomplete Registrations – Identify where potential attendees begin but do not complete the registration process.
- Previous Attendance – Distinguish returning participants from first-time attendees where appropriate.
- Special Requirements – Collect relevant dietary, accessibility, or participation requirements needed for event delivery.
Registration data provides an early picture of event demand, audience composition, marketing sources, registration behaviour, delegate requirements, and expected attendance, helping organizers make better planning decisions before the event.
2.2 Attendee Demographic Data
Relevant attendee information can help organizers understand who their audience is and whether the event is reaching its intended participants. The information collected should be limited to what is genuinely useful for the event’s objectives.
- Industry – Understand which business sectors or professional fields are represented.
- Organization – Identify participating companies, institutions, associations, government bodies, NGOs, or other organizations where relevant.
- Job Function – Segment delegates according to roles such as executives, managers, engineers, marketers, procurement professionals, entrepreneurs, or other professional categories.
- Location – Understand whether delegates are local, national, regional, or international where location information is relevant.
- Delegate Type – Categorize participants as customers, prospects, partners, employees, speakers, sponsors, exhibitors, media, or other appropriate groups.
- Seniority Level – For some business events, understanding whether attendees are executives, decision-makers, managers, specialists, or junior professionals may help with programme design.
- First-Time vs Returning Delegates – Determine whether the event is attracting new audiences while retaining previous participants.
- Professional Interests – Registration questions can identify topics, sessions, products, or business areas that delegates are interested in.
- Audience Segmentation – Appropriate demographic and professional information can support more relevant communication, sessions, networking, and post-event follow-up.
Attendee demographic data can help organizers understand who the event is attracting, which audience segments are represented, what participants are interested in, and whether the intended audience is being reached.
2.3 Marketing Performance Data
Marketing data helps organizers understand which promotional activities are creating awareness, generating interest, and ultimately producing registrations. This allows marketing resources to be allocated based on performance rather than assumptions.
- Website Traffic – Track visits to event pages, registration pages, speaker profiles, agendas, venue information, and other important content.
- Traffic Sources – Identify whether visitors come from search engines, email, social media, advertising, referrals, partner websites, or direct traffic.
- Email Engagement – Monitor relevant indicators such as email delivery, opens where reliably available, link clicks, and registration actions.
- Advertising Performance – Review impressions, clicks, costs, conversions, and other appropriate advertising metrics.
- Social-Media Engagement – Measure relevant interactions such as views, shares, comments, clicks, and visits to registration pages.
- Registration Conversions – Determine how many website visitors or campaign interactions result in completed registrations.
- Campaign Performance – Compare individual campaigns to understand which messages, audiences, or channels perform effectively.
- Cost per Registration – Where paid campaigns are involved, compare marketing expenditure with registrations generated.
- Registration Attribution – Use appropriate tracking methods to understand which marketing activities contributed to registrations, while recognizing that attribution may involve multiple interactions.
Marketing performance data connects promotion, audience attention, website behaviour, advertising, social media, email activity, and registrations, helping organizers understand which channels contribute most effectively to event participation.
2.4 Attendance Data
Registration numbers alone do not show how many people actually attended. Attendance data helps organizers understand the difference between expected and actual participation and can provide important information for future forecasting.
- Registered vs Actual Attendees – Compare total registrations with the number of delegates who physically or virtually participated.
- Attendance Rate – Calculate the percentage of registered participants who attended.
- No-Show Rate – Identify the proportion of confirmed delegates who did not attend.
- Arrival Times – Review when delegates arrived to improve registration staffing and programme scheduling.
- Session Attendance – Where appropriate, track participation across keynotes, workshops, breakout sessions, panels, and other programme areas.
- Repeat Attendance – Identify delegates who have participated in previous editions of the event.
- Virtual Attendance – For hybrid events, distinguish physical participation from online attendance.
- Peak Attendance Periods – Identify times when registration areas, conference rooms, exhibition areas, or catering facilities experience the greatest demand.
- Attendance by Delegate Category – Compare participation among customers, prospects, sponsors, exhibitors, employees, partners, or other relevant groups.
Attendance data shows who actually participated, when they arrived, which sessions they attended, and how actual attendance compared with registration expectations, improving future forecasting and operational planning.
2.5 Audience Engagement Data
Attendance indicates that someone was present, but engagement data can provide additional insight into how actively delegates interacted with the event, speakers, content, technology, and programme.
- Poll Participation – Measure how many delegates respond to live polls, surveys, quizzes, or voting activities.
- Questions Submitted – Track the number and topics of questions submitted during presentations and panel discussions.
- Session Ratings – Allow participants to evaluate individual presentations, workshops, or speakers.
- Event App Interactions – Review appropriate usage of schedules, speaker profiles, networking features, notifications, and other app functions.
- Content Downloads – Track downloads of presentations, reports, brochures, research, or other digital resources.
- QR-Code Interactions – Measure appropriate scans connected to sessions, exhibitor information, surveys, documents, or other content.
- Livestream Engagement – Review online viewing, questions, reactions, or other supported interactions.
- Survey Participation – Measure how many delegates complete event or session surveys.
- Engagement by Session – Compare participation across programme topics to identify content that generated stronger audience interaction.
Audience engagement data can reveal which sessions, speakers, topics, digital tools, and content generate active participation, providing a deeper view of event performance than attendance figures alone.
2.6 Networking Data
Networking is a major objective for many corporate conferences, exhibitions, trade shows, association meetings, and MICE events. Where suitable systems are available, organizers can measure aspects of how delegates connect and interact.
- Meetings Scheduled – Track business or networking meetings arranged through event platforms or structured programmes.
- Networking Participation – Measure participation in dedicated networking sessions, matchmaking programmes, or business lounges.
- Business Connections – Where appropriately recorded, track new professional connections generated through the event.
- Matchmaking Activity – Review whether recommended connections lead to accepted meeting requests or interactions.
- Exhibitor Interactions – Measure meetings or discussions between delegates and participating exhibitors.
- Sponsor Interactions – Track suitable engagement between delegates and sponsors where relevant.
- Networking Session Attendance – Compare participation across breakfasts, receptions, business matchmaking sessions, or other networking formats.
- Follow-Up Intentions – Surveys can ask delegates whether they intend to continue discussions or business relationships after the event.
- Networking Satisfaction – Participants can evaluate whether the event provided useful opportunities to meet relevant people.
Networking data can help organizers understand whether an event successfully created professional connections, meetings, exhibitor interactions, business conversations, and relationship-building opportunities.
2.7 Sponsor and Exhibitor Data
Sponsors and exhibitors often require evidence showing the value generated by their participation. Appropriate measurement can help organizers demonstrate visibility, interactions, leads, and audience engagement.
- Booth Visits – Track appropriate measures of delegate visits or interactions at exhibition stands.
- Leads Captured – Record prospects collected through approved lead-capture systems, QR codes, forms, or other methods.
- Content Interactions – Measure engagement with sponsor videos, presentations, downloads, QR codes, or digital materials.
- Sponsor Exposure – Document appropriate visibility across screens, stages, programmes, websites, livestreams, signage, or other agreed placements.
- Sponsored Session Attendance – Measure attendance at relevant sponsored presentations, workshops, demonstrations, or discussions.
- Product Demonstration Engagement – Track participation in product demonstrations or experience areas.
- Meeting Activity – Record scheduled business meetings involving exhibitors or sponsors where appropriate.
- Digital Engagement – Review suitable interactions with sponsor profiles, virtual booths, links, or event-app content.
- Lead Quality – Where possible, sponsors and exhibitors can distinguish between general interactions and prospects relevant to their business objectives.
- Sponsor Feedback – Post-event surveys can evaluate whether sponsorship objectives and expectations were achieved.
Sponsor and exhibitor data helps demonstrate visibility, booth engagement, lead generation, content interactions, meetings, and commercial opportunities, supporting more measurable sponsorship reporting.
2.8 Post-Event Feedback
Post-event feedback provides qualitative and quantitative information that may not be visible through registration, attendance, or engagement statistics alone. It can help explain why delegates behaved in certain ways and how they perceived the event experience.
- Delegate Satisfaction – Ask participants to evaluate their overall event experience.
- Speaker Feedback – Gather opinions about speaker relevance, presentation quality, expertise, and usefulness.
- Session Ratings – Compare feedback across keynotes, panels, workshops, breakout sessions, and other programme elements.
- Content Relevance – Determine whether presentations and discussions addressed delegate interests and professional needs.
- Venue Feedback – Ask about location, accessibility, room layouts, facilities, comfort, catering areas, and other venue considerations.
- Audiovisual Experience – Gather feedback about sound clarity, screen visibility, lighting, presentations, livestreaming, and hybrid participation where relevant.
- Catering Feedback – Review food quality, variety, service, dietary options, and refreshment arrangements.
- Networking Feedback – Ask whether delegates had sufficient opportunities to make relevant professional connections.
- Suggestions for Improvement – Provide opportunities for delegates to identify issues not covered by structured questions.
- Future Event Interests – Ask which topics, speakers, formats, locations, or experiences participants would value at future events.
Post-event feedback adds context to numerical data by showing what delegates valued, what caused dissatisfaction, which content was useful, and what should be improved in future events.
Event organizers should collect data that provides meaningful insights into who attended, how they discovered the event, what they engaged with, what they valued, and whether the event achieved its objectives.
A useful event dataset can combine registration information, relevant attendee characteristics, marketing performance, actual attendance, audience engagement, networking activity, sponsor and exhibitor results, and post-event feedback. When these information sources are analyzed together, organizers can understand not only how many people participated but also how participants behaved and what outcomes the event generated.
However, collecting more information does not automatically produce better decisions. Organizers should focus on relevant and reliable data, establish a clear purpose for each measurement, and handle personal information responsibly. The most valuable event data is information that can be converted into practical decisions about marketing, programme design, delegate experience, sponsorship, venues, catering, audiovisual production, staffing, budgets, and future event strategy.
3. How to Use Data Before an Event

Data-Driven Event Planning Strategies
Pre-event data allows organizers to make important planning decisions before significant resources have been committed. Historical event records, current registrations, marketing analytics, delegate preferences, previous budgets, attendance patterns, survey results, venue information, and technical requirements can all provide useful evidence for planning corporate conferences, exhibitions, AGMs, product launches, workshops, summits, networking events, trade shows, executive meetings, and MICE events.
Using this information early can improve forecasting and help align venue capacity, budgets, marketing, agendas, catering, delegate communication, staffing, and audiovisual production with realistic event requirements.
3.1 Select the Right Venue
Venue selection can benefit significantly from historical attendance and current registration information. Rather than choosing a venue based primarily on maximum capacity or appearance, organizers can estimate the space actually required for the expected audience and event format
- Historical Attendance – Review attendance figures from previous editions of the event to establish realistic expectations.
- Registration Forecasts – Current registrations can indicate whether attendance is likely to increase or decrease compared with previous events.
- Registration-to-Attendance Rates – Historical no-show patterns can help estimate how many registered delegates are likely to attend.
- Audience Growth – Year-on-year attendance data can indicate whether additional venue capacity may be necessary.
- Session Requirements – Previous breakout-session attendance can help determine the number and size of meeting rooms required.
- Delegate Categories – Exhibitors, sponsors, VIPs, speakers, media, and other groups may require additional dedicated spaces.
- Networking Requirements – Data on networking participation can help determine whether lounges, meeting areas, or business-matching spaces are needed.
- Hybrid Participation – Expected online participation may influence the size and technical requirements of the physical venue.
- Space Utilization – Historical information can identify rooms or areas that were overcrowded or underused during previous events.
Attendance and participation data can help organizers select a venue that provides appropriate capacity, breakout spaces, exhibition areas, networking facilities, technical infrastructure, and delegate comfort without unnecessarily oversizing the event space.
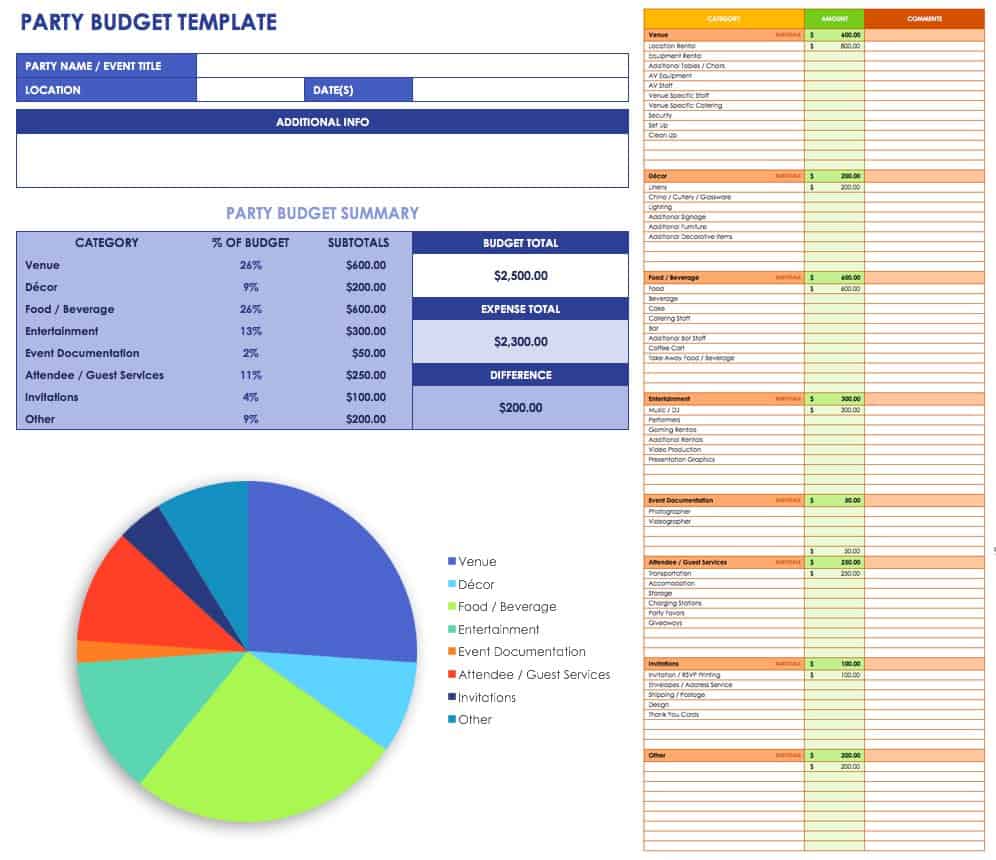
3.2 Build Accurate Event Budgets
Historical financial information can provide a practical starting point for developing future event budgets. Previous expenditure can show where resources were used, which areas exceeded expectations, and which costs were influenced by attendance or programme changes.
- Previous Event Costs – Review actual expenditure from comparable events rather than relying only on original budgets.
- Budget Variances – Compare planned expenditure with actual spending to identify areas that consistently exceed estimates.
- Cost per Delegate – Where useful, divide appropriate event costs by actual attendance to understand how expenditure changes with audience size.
- Venue Costs – Historical venue expenditure can support comparisons involving room hire, accommodation, catering, power, internet, and related services.
- Catering Costs – Attendance and consumption data can improve food and beverage budgeting.
- Audiovisual Costs – Previous technical specifications can help estimate sound, screens, staging, lighting, livestreaming, and video-production requirements.
- Marketing Costs – Compare campaign expenditure with registrations or other relevant marketing outcomes.
- Transport Costs – Historical shuttle, airport-transfer, equipment-delivery, and logistical expenses can support future estimates.
- Contingency Planning – Previous unexpected expenses can help organizers identify areas where reasonable contingencies may be required.
Historical financial and attendance data can improve budgeting by helping organizers forecast venue, catering, marketing, audiovisual, transport, staffing, accommodation, and other event costs more realistically.
3.3 Forecast Delegate Numbers
Accurate delegate forecasting influences almost every major event-planning decision. Registration trends can be combined with historical attendance patterns to develop a more realistic estimate of final participation.
- Current Registration Numbers – Track how many people have registered at different stages of the campaign.
- Registration Pace – Compare registrations per day or week with previous events.
- Historical Registration Curves – Determine whether delegates normally register early or closer to the event date.
- No-Show Rates – Previous registration-to-attendance ratios can improve final attendance estimates.
- Delegate Categories – Forecast attendance separately for customers, employees, sponsors, exhibitors, speakers, VIPs, media, or other groups where useful.
- Marketing Activity – Major campaigns, speaker announcements, partnerships, or programme releases may influence registration patterns.
- Event Capacity – Forecasts can indicate whether registrations should be increased, limited, or placed on a waiting list.
- Physical and Virtual Attendance – Hybrid events should distinguish expected in-person participation from remote attendance.
- Forecast Updates – Attendance estimates should be revised as new registration information becomes available.
Delegate forecasting combines registration numbers, registration pace, historical trends, no-show rates, audience categories, marketing activity, and event format to estimate final attendance more accurately.
3.4 Improve Event Marketing
Marketing data can help organizers understand which channels and messages are contributing to registrations rather than treating every promotional activity as equally effective.
- Traffic Sources – Identify whether potential delegates arrive through search engines, email, social media, advertisements, partners, referrals, or direct visits.
- Registration Conversions – Compare website visits or campaign interactions with completed registrations.
- Email Performance – Review appropriate measures such as link clicks, registrations, and other campaign actions.
- Advertising Performance – Compare impressions, clicks, costs, and conversions across campaigns.
- Social-Media Engagement – Identify posts, topics, videos, speakers, or announcements generating meaningful interactions.
- Audience Segments – Determine which industries, organizations, professional roles, or delegate groups respond to different campaigns.
- Content Performance – Compare interest in speaker announcements, agenda topics, venue information, videos, or other promotional content.
- Marketing Spend – Allocate more resources to channels that demonstrate useful results while reviewing weaker campaigns.
- Campaign Timing – Registration patterns can show when promotional activity should be intensified.
Marketing data can help organizers focus resources on channels, campaigns, audiences, messages, and content that contribute most effectively to registrations and engagement.
3.5 Personalize Event Communication
Not every delegate needs exactly the same information. Appropriate segmentation can make pre-event communication more relevant while avoiding unnecessary or repetitive messages.
- Industry Segmentation – Share relevant sessions or content with delegates from particular sectors.
- Job-Role Segmentation – Executives, technical professionals, marketers, procurement teams, and other groups may value different information.
- Interest-Based Communication – Registration preferences can help identify topics or sessions relevant to individual delegate groups.
- First-Time Attendees – New delegates may require additional information about registration, venue navigation, programme structure, and networking.
- Returning Delegates – Previous attendees may benefit from communication highlighting what has changed or been added.
- Speaker Communication – Speakers can receive dedicated information about presentation formats, deadlines, technical requirements, and rehearsal schedules.
- Exhibitor Communication – Exhibitors may need logistics, setup schedules, lead-capture information, branding specifications, and venue access instructions.
- Virtual Delegates – Online participants should receive platform access, technical instructions, schedules, and digital participation guidance.
- Accessibility and Dietary Requirements – Relevant information can help organizers prepare appropriate support and services.
Delegate segmentation allows organizers to provide more relevant information based on interests, roles, industries, attendance history, participation format, and event requirements.
3.6 Design Better Conference Agendas
Programme design can use historical session attendance, feedback, engagement information, and registration preferences to understand which topics and formats are most relevant to delegates.
- Previous Session Attendance – Identify topics that attracted high or low participation.
- Session Ratings – Compare delegate evaluations across presentations, panels, workshops, and breakout sessions.
- Audience Questions – Frequently asked questions can reveal topics requiring deeper discussion.
- Pre-Event Surveys – Ask delegates which subjects or challenges they would like addressed.
- Registration Preferences – Session selection during registration can provide early indicators of demand.
- Speaker Performance – Historical feedback can help organizers understand which presentation styles or expertise audiences valued.
- Session Format – Compare engagement across keynotes, panels, workshops, demonstrations, roundtables, and interactive sessions.
- Session Timing – Attendance patterns may reveal whether certain programme periods consistently experience lower participation.
- Room Allocation – High-interest sessions can be assigned to larger rooms based on expected demand.
Agenda data can help organizers develop programmes based on delegate interests, previous attendance, feedback, questions, session formats, speaker performance, and expected demand.
3.7 Improve Catering Planning
Catering is strongly influenced by attendance, programme schedules, dietary requirements, and delegate behaviour. Data can help organizers move beyond simply ordering meals for the total number of registrations.
- Attendance Forecasts – Estimate realistic meal requirements using expected actual attendance rather than registrations alone.
- Historical No-Show Rates – Previous differences between registrations and attendance can improve catering estimates.
- Dietary Requirements – Registration information can identify vegetarian, allergy-related, religious, or other relevant meal requirements.
- Meal Participation – Not every delegate may attend breakfast, lunch, cocktails, gala dinners, or other catered activities.
- Session Schedules – Programme timing determines when refreshments and meals need to be served.
- Historical Consumption – Previous catering records can show which meals or items were over- or under-supplied.
- Delegate Categories – Speakers, staff, exhibitors, technical teams, and other participants may have different catering schedules.
- Catering Budget Forecasts – Expected attendance can help estimate food and beverage expenditure.
- Food-Waste Reduction – Better forecasting can reduce unnecessary food preparation while maintaining reasonable operational contingencies.
Attendance, dietary, programme, and historical consumption data can improve meal quantities, catering budgets, dietary planning, service timing, and food-waste prevention.
3.8 Plan Audiovisual Requirements
Audiovisual production should be based on the actual characteristics of the event rather than a generic equipment package. Data about audience numbers, venue size, programme formats, speakers, presentations, remote participation, recording, and livestreaming can help determine suitable technical specifications.
- Audience Numbers – Expected attendance influences sound coverage, screen visibility, microphone requirements, and technical infrastructure.
- Venue Size and Layout – Room dimensions, ceiling height, seating arrangements, breakout spaces, and viewing distances affect equipment selection.
- Presentation Formats – Slides, videos, demonstrations, panel discussions, entertainment, and other content require different technical arrangements.
- Speaker Numbers – The number and type of speakers can determine microphone, stage-monitoring, presentation, and communication requirements.
- Panel Discussions – Panel size and audience Q&A requirements influence microphone quantities and stage layouts.
- Remote Speakers – Virtual presenters require reliable video, audio, internet, screen, and platform integration.
- Virtual Delegates – Expected online audiences can influence livestreaming capacity and digital engagement requirements.
- LED Screen Requirements – Audience size, viewing distance, content type, stage dimensions, and venue layout can guide screen specification.
- Video Production – Recording objectives can determine camera quantities, camera positions, lighting, audio, and production requirements.
- Breakout Sessions – Attendance forecasts can help determine which rooms require additional sound, screens, microphones, or recording systems.
- Technical Site Surveys – Venue and programme information can guide a professional site assessment before final equipment specifications are confirmed.
Event data allows audiovisual production to be designed around actual audience numbers, venue conditions, speakers, programme formats, presentations, remote participation, livestreaming, and recording requirements, helping avoid both under-specification and unnecessary equipment.
Pre-event data helps organizers make more informed decisions about venues, budgets, marketing, delegate numbers, agendas, catering, communication, and technical production.
Historical information provides useful benchmarks, while current registration, marketing, survey, and delegate data allows forecasts to be updated as the event approaches. These insights can help planners choose appropriately sized venues, develop realistic budgets, allocate marketing resources, design relevant programmes, prepare suitable catering quantities, and communicate more effectively with different delegate groups.
For audiovisual production, data-driven planning is particularly useful because technical requirements should reflect venue size, expected attendance, programme structure, speaker numbers, content formats, hybrid participation, livestreaming, and recording objectives. Using reliable information before the event allows organizers and technical providers to develop solutions based on actual requirements rather than assumptions.
4. Using Real-Time Data During Events

Data-Driven Event Planning Strategies
Real-time event data gives organizers visibility into what is happening while an event is taking place, rather than relying entirely on post-event reports. For corporate conferences, exhibitions, AGMs, product launches, workshops, summits, networking events, trade shows, executive meetings, and MICE events, live information can help teams respond to changes in attendance, room occupancy, audience engagement, online participation, catering demand, technical performance, and delegate movement.
Real-time monitoring does not mean every metric requires an immediate reaction. The objective is to identify useful signals, verify what they mean, and make practical adjustments when they can improve delegate experience, safety, programme delivery, technical reliability, and operational efficiency.
4.1 Digital Registration and Check-In
Digital registration and check-in systems can provide immediate information about how many delegates have arrived, when they arrived, and how actual attendance compares with registrations.
- Actual Attendance – Check-in records can show how many registered delegates have physically arrived.
- Registration vs Attendance – Organizers can compare expected numbers with actual participation as the event progresses.
- Arrival Patterns – Check-in timestamps can reveal when delegate arrivals peak.
- Registration Queues – Teams can monitor congestion and open additional registration points where practical.
- Walk-In Delegates – Appropriate systems can record participants who register at the venue.
- Delegate Categories – Organizers can monitor arrivals among speakers, VIPs, sponsors, exhibitors, media, staff, and other groups.
- Badge Collection – Digital records can indicate which registered delegates have completed accreditation.
- Operational Updates – Actual attendance can be communicated to catering, venue, security, and event-management teams where relevant.
- Future Planning Data – Arrival patterns can be retained for improving registration staffing and schedules at future events.
Digital check-in provides a real-time view of actual attendance, arrival patterns, registration activity, delegate categories, and potential congestion, allowing teams to respond more effectively during the event.
4.2 Session Attendance Tracking
Session-level attendance can show how delegates move through the programme and which topics, speakers, workshops, or formats generate stronger participation.
- Popular Sessions – High attendance can indicate strong interest in particular topics or speakers.
- Under-Attended Sessions – Low participation can identify sessions that may require further investigation.
- Room Capacity – Attendance information can help teams identify rooms approaching comfortable or permitted capacity.
- Breakout Room Allocation – Where operationally practical, high-demand sessions may be moved to more suitable rooms.
- Delegate Movement – Session data can help organizers understand how participants move between programme areas.
- Topic Interest – Attendance patterns can provide evidence about subjects delegates find relevant.
- Session Timing – Organizers can identify periods when participation increases or decreases.
- Format Performance – Attendance can be compared across panels, workshops, keynotes, demonstrations, and roundtables.
- Future Programme Planning – Session-level information provides useful evidence for future agendas and room allocations.
Session attendance data helps organizers understand topic demand, room utilization, delegate movement, programme performance, and session popularity while creating valuable information for future event planning.
4.3 Live Polling
Live polling turns delegates from passive listeners into active participants while giving speakers and organizers immediate information about audience opinions, knowledge, preferences, or experiences.
- Audience Opinions – Speakers can ask delegates about relevant industry issues, challenges, or preferences.
- Knowledge Checks – Training sessions can use polls to assess understanding before or after presenting information.
- Pre- and Post-Session Comparison – Similar questions can help show whether audience responses changed during a presentation.
- Instant Feedback – Presenters can receive immediate responses instead of waiting for post-event surveys.
- Content Direction – Poll results can help speakers determine which topics require additional explanation.
- Audience Participation – Interactive questions can encourage delegates to participate actively.
- Anonymous Responses – Where platforms support anonymity, delegates may feel more comfortable answering certain questions.
- Results Visualization – Responses can be displayed on screens in suitable formats such as percentages, charts, or word clouds.
- Post-Event Analysis – Poll results can be retained and compared with other engagement information.
Live polling provides immediate insight into audience opinions, knowledge, preferences, and engagement, while allowing presenters to adapt discussions where appropriate.
4.4 Digital Q&A
Digital Q&A platforms allow delegates to submit questions through event apps, web platforms, QR-linked systems, or other suitable tools. The resulting data can reveal recurring interests and concerns across an audience.
- Question Submission – Delegates can submit questions without necessarily approaching a physical microphone.
- Question Volume – Organizers can see which sessions generate substantial audience interest.
- Recurring Topics – Similar questions can reveal themes that deserve additional discussion.
- Question Voting – Some platforms allow delegates to support questions they would most like answered.
- Moderation – Moderators can organize, prioritize, and direct questions to appropriate speakers.
- Remote Participation – Virtual delegates can participate in Q&A alongside physical audiences.
- Speaker Insights – Questions can show where presentations require further explanation or clarification.
- Unanswered Questions – Remaining questions can inform follow-up articles, webinars, emails, FAQs, or future sessions.
- Post-Event Content – Frequently asked questions can provide useful ideas for future educational content.
Digital Q&A provides information about delegate interests, recurring questions, content gaps, session engagement, and future content opportunities while supporting participation from both physical and remote audiences.
4.5 Event App Analytics
Event apps and digital event platforms can provide a broader picture of how delegates interact with schedules, speakers, documents, networking tools, notifications, and other event resources.
- Agenda Views – Track which sessions or programme pages attract attention.
- Speaker Profile Views – Identify speakers generating delegate interest.
- Content Downloads – Monitor downloads of presentations, reports, brochures, research, or other resources.
- Notification Engagement – Review whether delegates interact with important announcements or programme updates.
- Networking Activity – Suitable platforms can record meeting requests, accepted connections, or other networking interactions.
- Exhibitor Profile Views – Measure interest in participating exhibitors or suppliers.
- Sponsor Content Engagement – Track suitable interactions with sponsor profiles, videos, links, or digital materials.
- Session Bookmarks – Saved sessions can provide an additional indication of programme interest.
- Survey Responses – Apps can distribute and collect session or event feedback while delegates are still participating.
Event app analytics can reveal how delegates interact with agendas, speakers, content, networking features, sponsors, exhibitors, notifications, and surveys, providing another layer of real-time engagement information.
4.6 Live Streaming Analytics
Hybrid and livestreamed events can generate information about remote audiences that would not appear in physical venue attendance figures. Streaming analytics can help organizers understand the size, behaviour, and reach of online participation.
- Concurrent Viewers – Monitor how many people are watching at a particular time where the platform provides this metric.
- Total Views – Track overall viewing activity according to the platform’s measurement definitions.
- Viewing Duration – Determine how long online audiences remain engaged with the stream where reliable metrics are available.
- Peak Viewing Periods – Identify programme segments that attract the largest online audiences.
- Audience Drop-Off – Review when significant numbers of viewers stop watching.
- Geographic Reach – Appropriate analytics may indicate countries, regions, or other broad locations represented within the online audience.
- Device Information – Some platforms provide information about whether audiences watch using computers, smartphones, tablets, or other devices.
- Online Questions and Comments – Monitor interactions from remote participants.
- Recorded Content Performance – Continue measuring views after the live programme where recordings remain available.
Livestream analytics can provide insight into online audience size, viewing duration, geographic reach, peak viewing periods, audience retention, and digital engagement, helping organizers evaluate the virtual component of hybrid events.
4.7 Social Media Monitoring
Social media can provide additional information about how delegates, speakers, sponsors, exhibitors, and other audiences discuss an event. Monitoring should focus on meaningful interactions rather than treating every view or reaction as evidence of event success.
- Event Mentions – Monitor appropriate references to the event name, organization, speakers, or event hashtag.
- Audience Reactions – Review comments and discussions surrounding presentations, announcements, and event experiences.
- Content Sharing – Identify event photographs, videos, speaker quotes, announcements, or other content being shared.
- Speaker Engagement – Monitor digital conversations around keynote speakers, panelists, and presenters.
- Sponsor Visibility – Review appropriate social engagement associated with sponsors and partners.
- Popular Topics – Frequently discussed themes can indicate areas generating interest.
- Questions and Concerns – Public posts may reveal issues requiring clarification or operational attention.
- User-Generated Content – Delegate-created photographs, videos, and posts can demonstrate how attendees are experiencing the event.
- Post-Event Content Opportunities – Popular discussions can inform articles, videos, interviews, FAQs, and future programme topics.
Social media monitoring can provide additional insight into event visibility, audience reactions, popular topics, content sharing, speaker engagement, sponsor exposure, and emerging delegate concerns.
4.8 Operational Monitoring
Real-time data is particularly valuable when it helps event teams solve operational problems before they significantly affect delegates. Information can come from digital systems as well as direct observations from venue, catering, technical, security, registration, and production teams.
- Registration Queues – Monitor waiting times and deploy additional registration staff or check-in points where required.
- Room Occupancy – Identify crowded or underused spaces and adjust room management where practical.
- Technical Issues – Track microphone, screen, lighting, presentation, internet, livestreaming, or other audiovisual problems.
- Catering Demand – Monitor meal and refreshment consumption to support appropriate replenishment.
- Delegate Movement – Observe congestion around entrances, corridors, exhibition areas, breakout rooms, and catering spaces.
- Transport Operations – Monitor shuttle departures, airport transfers, delays, and delegate pickup arrangements.
- Speaker Readiness – Track speaker arrivals, presentation files, rehearsals, microphones, and stage requirements.
- Programme Timing – Monitor sessions running ahead of or behind schedule and communicate adjustments.
- Livestreaming Performance – Technical teams can monitor video, audio, connectivity, platform performance, and remote-speaker connections.
- Incident Reporting – Centralized communication can help operational teams document and respond to issues consistently.
- Team Communication – Event managers, venue teams, AV technicians, caterers, security, transport providers, and other departments can share relevant updates through coordinated channels.
Operational monitoring turns real-time information into practical action by helping teams respond to queues, room capacity, catering demand, programme timing, transport, technical problems, delegate movement, and other changing event conditions.
Real-time data allows event teams to identify changing conditions and make informed adjustments to delegate management, room allocation, content, communication, technical production, and event operations.
Digital check-in can show who has arrived, session tracking can reveal programme demand, live polling and Q&A can provide immediate audience insights, and event apps can show how delegates interact with schedules, content, networking tools, sponsors, and exhibitors. For hybrid events, livestream analytics can add information about remote audience size, viewing behaviour, geographic reach, and online engagement.
The greatest value comes from connecting data with an appropriate operational response. A crowded registration area may require additional check-in capacity; a high-demand session may require better room management; recurring audience questions may influence the discussion; and a technical issue may require immediate intervention from the production team. Used this way, real-time data becomes a practical tool for delivering more responsive, efficient, engaging, and professionally managed events.
5. Personalization, AI and Predictive Event Analytics

Data-Driven Event Planning Strategies
As event platforms collect information from registration systems, event apps, websites, marketing platforms, session tracking, surveys, networking tools, livestreaming platforms, and post-event feedback, organizers can use analytics and artificial intelligence to identify patterns and make event experiences more relevant.
For corporate conferences, exhibitions, AGMs, product launches, summits, workshops, networking events, trade shows, executive meetings, and MICE events, these technologies can support personalization, attendance forecasting, networking, programme planning, audience analysis, operational planning, and reporting. However, AI-generated recommendations and predictions should be treated as decision-support tools rather than guaranteed outcomes, and personal information should be handled responsibly.
5.1 Personalized Session Recommendations
Large conferences may offer multiple keynotes, workshops, breakout sessions, panel discussions, demonstrations, and networking activities. Delegate information can help event platforms recommend sessions that are more relevant to individual participants.
- Registration Interests – Topics selected during registration can provide an initial indication of delegate preferences.
- Industry Information – Sessions can be recommended according to relevant sectors such as technology, finance, healthcare, manufacturing, energy, construction, or other industries.
- Professional Roles – Executives, marketers, engineers, procurement professionals, entrepreneurs, and other groups may have different programme interests.
- Previous Session Attendance – Returning delegates’ historical participation can provide useful indicators where appropriate.
- Saved Sessions – Sessions bookmarked within an event app can help refine programme recommendations.
- Content Interactions – Downloads, speaker-profile views, agenda searches, or other relevant interactions may indicate areas of interest.
- Session Capacity – Recommendation systems can consider available space before directing additional delegates toward popular sessions.
- Personalized Agendas – Event platforms can help participants create schedules from recommended and manually selected sessions.
- Delegate Control – Recommendations should support rather than replace individual choice, allowing delegates to select the sessions they consider most useful.
Personalized session recommendations can help delegates navigate complex programmes by connecting professional interests, roles, industries, previous participation, and digital interactions with potentially relevant event content.
5.2 Personalized Networking
Networking platforms can use delegate information to suggest potentially useful professional connections rather than leaving every participant to discover relevant contacts independently.
- Industry Matching – Connect delegates operating in related or complementary sectors.
- Professional Role Matching – Identify participants whose responsibilities or expertise may be relevant to each other.
- Business Objectives – Match delegates seeking suppliers, customers, investors, partners, distributors, or professional expertise.
- Shared Interests – Common topics selected during registration can support networking recommendations.
- Buyer-Seller Matching – Trade shows and exhibitions can use structured information to connect potential buyers with appropriate exhibitors.
- Investor-Founder Matching – Business forums may connect entrepreneurs with suitable investors or financial institutions.
- Scheduled Meetings – Platforms can allow delegates to request and confirm meetings before or during an event.
- Networking Availability – Recommendations can consider available meeting times and programme schedules.
- Connection Recommendations – Algorithms can suggest potential contacts based on relevant participant information.
- Delegate Choice – Participants should remain free to accept, reject, or ignore suggested connections.
Personalized networking can help transform large delegate lists into more focused opportunities for business meetings, partnerships, supplier discovery, lead generation, investment discussions, and professional relationship building.
5.3 Personalized Event Communication
Data can also help organizers deliver information according to the needs of different delegate groups rather than sending every participant exactly the same messages.
- Session Reminders – Delegates can receive reminders for sessions they have selected or bookmarked.
- Speaker Updates – Participants interested in particular sessions can receive relevant programme changes.
- Venue Information – Different delegate groups can receive appropriate room, entrance, parking, or access information.
- Virtual Delegate Instructions – Online attendees can receive streaming links, platform instructions, and digital participation guidance.
- Speaker Communication – Presenters can receive rehearsal schedules, presentation deadlines, technical instructions, and stage information.
- Exhibitor Communication – Exhibitors can receive setup times, logistics instructions, booth information, and venue access details.
- VIP Communication – Appropriate arrival, protocol, meeting, or hospitality information can be shared with designated participants.
- Networking Reminders – Delegates can receive notifications about scheduled meetings or matchmaking sessions.
- Programme Changes – Relevant audiences can be notified when sessions, rooms, or timings change.
- Post-Event Follow-Up – Communication can be tailored according to sessions attended, interests, downloads, or other appropriate interactions.
Personalized communication can make event information more useful by providing relevant schedules, reminders, instructions, programme updates, networking information, and follow-up content to appropriate delegate groups.
5.4 AI-Assisted Data Analysis
Events can generate information across multiple systems, making manual analysis increasingly difficult as event size and complexity grow. AI-assisted tools can help organizers examine larger datasets and identify patterns that may deserve further investigation.
- Registration Patterns – AI-assisted analysis can help identify trends in registration timing, delegate categories, or campaign responses.
- Attendance Patterns – Data can be examined for relationships between registration behaviour and actual attendance.
- Session Engagement – Analytics can compare attendance, ratings, questions, polls, and other engagement indicators.
- Marketing Performance – Data from different campaigns can be organized to identify patterns in registrations and engagement.
- Delegate Segmentation – Relevant attendee information can be grouped into useful audience segments.
- Survey Analysis – Large quantities of structured and unstructured feedback can be categorized more efficiently.
- Operational Patterns – Historical information about queues, room occupancy, catering, transport, or technical incidents may reveal recurring issues.
- Cross-Event Analysis – Multiple editions of an event can be compared to identify longer-term trends.
- Anomaly Detection – Analytical systems may help highlight unusual changes or results that deserve human review.
- Human Verification – Organizers should validate AI-generated findings before using them for significant decisions.
AI-assisted analysis can help event teams process larger volumes of information and identify patterns, relationships, anomalies, and potential insights, while experienced organizers remain responsible for interpreting the results.
5.5 Attendance Forecasting
Predictive analytics can combine historical attendance with current registration activity to estimate likely final participation. These forecasts can be updated as new information becomes available.
- Historical Attendance – Previous event participation provides a baseline for forecasting.
- Registration Pace – Current registrations can be compared with the same period before previous events.
- No-Show Patterns – Historical registration-to-attendance ratios can improve estimates.
- Delegate Categories – Customers, employees, exhibitors, speakers, sponsors, VIPs, and other groups may have different attendance patterns.
- Marketing Activity – Campaign launches, speaker announcements, partnerships, and promotional activity can influence registration trends.
- Event Timing – Day of the week, programme duration, and other scheduling factors may be relevant where historical evidence exists.
- Physical vs Virtual Participation – Hybrid events can forecast each audience separately.
- Forecast Ranges – Where uncertainty is significant, planners can use reasonable ranges rather than relying on a single exact number.
- Continuous Updating – Forecasts should be revised as registration deadlines approach and new information becomes available.
Attendance forecasting can support decisions involving venue capacity, catering, staffing, registration, transport, seating, delegate materials, and audiovisual requirements, although forecasts should be treated as estimates rather than guarantees.
5.6 Predicting Popular Sessions
Registration preferences and historical engagement can help organizers anticipate which sessions may attract larger audiences before the programme begins.
- Historical Session Attendance – Previous participation can indicate recurring areas of interest.
- Session Bookmarks – Event-app saves can provide early signals of expected demand.
- Registration Selections – Pre-booked sessions provide stronger indications where delegates reserve places in advance.
- Speaker Interest – Speaker-profile views and related engagement can help identify anticipated demand.
- Topic Popularity – Website searches, downloads, surveys, and marketing engagement can reveal subjects attracting attention.
- Previous Session Ratings – Highly rated topics or speakers may attract returning participants.
- Audience Questions – Frequently discussed themes can influence future session demand.
- Room Allocation – High-demand sessions can be assigned to appropriately sized rooms.
- Technical Requirements – Expected attendance can influence screen sizes, sound coverage, microphones, camera positions, and other AV requirements.
- Overflow Planning – For high-interest sessions, organizers can consider suitable overflow spaces or digital viewing arrangements where practical.
Predicting session demand can improve room allocation, programme scheduling, staffing, seating, audiovisual planning, and delegate movement, while reducing the risk of overcrowded or significantly underused spaces.
5.7 Sentiment and Feedback Analysis
Large events can generate hundreds or thousands of survey comments, session reviews, social-media discussions, open-text responses, and other forms of feedback. AI-assisted analysis can help organize this information into manageable themes.
- Feedback Categorization – Comments can be grouped into themes such as content, venue, catering, registration, networking, speakers, or technical production.
- Recurring Complaints – Repeated concerns can be identified for further investigation.
- Positive Themes – Organizers can identify aspects of the event that participants frequently valued.
- Session Feedback – Comments can be organized according to particular speakers or programme sessions.
- Venue Feedback – Responses concerning accessibility, comfort, location, facilities, and room layouts can be grouped.
- Audiovisual Feedback – Comments about sound, screen visibility, lighting, livestreaming, or presentation quality can be analyzed.
- Networking Feedback – Organizers can identify whether delegates considered networking opportunities useful.
- Trend Comparison – Feedback themes can be compared across different event editions.
- Human Review – Automated sentiment classification can misinterpret context, irony, technical language, or ambiguous comments, so important conclusions should be checked.
AI-assisted feedback analysis can make large volumes of delegate comments easier to review by identifying recurring themes, positive experiences, complaints, content preferences, and potential areas for improvement.
5.8 Automated Event Reporting
Event information is often distributed across registration platforms, marketing systems, event apps, surveys, livestreaming tools, networking platforms, spreadsheets, and financial records. Automated reporting can bring relevant information together into dashboards or structured reports.
- Registration Dashboards – Display registration totals, trends, delegate categories, and sources.
- Attendance Reporting – Compare registrations with actual check-ins and session participation.
- Marketing Dashboards – Consolidate appropriate information about traffic, campaigns, advertising, and registration conversions.
- Engagement Reporting – Combine polling, Q&A, session ratings, app interactions, and content downloads.
- Networking Reports – Summarize meetings, matchmaking activity, and other relevant interactions.
- Sponsor Reports – Consolidate booth activity, leads, content interactions, sponsored-session attendance, and agreed visibility measures.
- Livestream Reports – Include online audiences, viewing duration, engagement, and other platform-provided metrics.
- Feedback Reports – Summarize ratings, survey results, comments, and recurring themes.
- Operational Reporting – Record relevant information about queues, catering, transport, room utilization, technical issues, and other event operations.
- Executive Dashboards – Present a focused selection of KPIs aligned with the event’s primary business objectives.
- Post-Event Reports – Bring together objectives, results, analysis, lessons learned, and recommendations for future events.
Automated reporting can consolidate information from multiple systems into clear dashboards and reports, helping organizers, sponsors, management teams, and other stakeholders understand event performance more efficiently
AI and analytics can help transform raw event data into more useful insights for personalization, forecasting, networking, content planning, reporting, and future event improvement.
Personalization can help delegates discover relevant sessions, professional contacts, programme information, and event content. Predictive analytics can support estimates of attendance and session demand, while AI-assisted analysis can help organizers identify patterns across registration, marketing, engagement, surveys, operational records, and feedback.
However, AI should support rather than replace professional event-management judgment. Forecasts may be uncertain, automated sentiment analysis can misinterpret context, and recommendations can reflect limitations in the underlying data. Event organizers should therefore combine reliable data, appropriate technology, responsible data practices, human verification, and practical event experience when making important decisions.
6. Measuring Event Performance and ROI

Data-Driven Event Planning Strategies
Measuring event performance helps organizations determine whether a corporate conference, exhibition, AGM, product launch, workshop, summit, networking event, trade show, executive meeting, or MICE event achieved its intended objectives. Rather than judging success only by the number of people in the room, organizers can examine registration, attendance, engagement, leads, sponsorship outcomes, delegate satisfaction, content performance, costs, and longer-term business results.
The most useful measurement framework begins before the event by establishing clear objectives and selecting KPIs connected to those objectives. This makes it possible to compare planned outcomes with actual results and identify areas for future improvement.
6.1 Registration Conversion Rate
Registration conversion rate can help organizers understand how effectively event marketing turns interested prospects into registered delegates. The calculation should use a clearly defined audience or traffic source so that comparisons remain meaningful.
- Registration Page Visitors – Track the number of relevant visitors reaching event registration pages.
- Completed Registrations – Measure how many visitors successfully complete the registration process.
- Conversion Rate – For a website registration funnel, this can be calculated as completed registrations divided by relevant registration-page visitors, multiplied by 100.
- Traffic Source Performance – Compare registrations generated through email, search engines, social media, advertising, partners, referrals, and other channels.
- Campaign Conversion – Evaluate which individual campaigns generate completed registrations rather than only clicks or impressions.
- Audience Segment Performance – Compare conversion patterns among different professional groups, industries, organizations, or target audiences where appropriate.
- Registration Abandonment – Identify where potential attendees begin but fail to complete the process.
- Registration Timing – Determine when conversion increases or decreases during the promotional period.
- Cost per Registration – For paid campaigns, compare relevant marketing expenditure with registrations generated.
Registration conversion measurement helps organizers understand whether event marketing, landing pages, messaging, audience targeting, and registration processes are effectively turning interest into confirmed participation.
6.2 Attendance Rate
Registration does not necessarily mean attendance. Measuring the percentage of registered delegates who actually participate provides a clearer understanding of event turnout and can improve future attendance forecasting.
- Total Registrations – Establish the number of confirmed registrations before the event.
- Actual Check-Ins – Record delegates who physically or virtually attend according to clearly defined criteria.
- Attendance Rate – Calculate actual attendees as a percentage of relevant registered delegates.
- No-Show Rate – Measure the proportion of registered participants who did not attend.
- Attendance by Delegate Type – Compare turnout among customers, prospects, employees, partners, sponsors, exhibitors, VIPs, or other groups.
- Physical vs Virtual Attendance – Hybrid events should distinguish in-person delegates from online participants.
- Repeat Attendance – Track returning participants where relevant.
- Session Attendance – Go beyond overall turnout by measuring participation in individual programme sessions.
- Historical Comparison – Compare attendance rates with previous editions to identify changes in delegate behaviour.
Attendance rate provides a more accurate picture of actual participation, no-shows, delegate behaviour, and programme demand than registration totals alone.
6.3 Audience Engagement
Attendance shows that delegates participated, but engagement data can help reveal how actively they interacted with speakers, sessions, digital content, networking activities, exhibitors, and event technology.
- Session Participation – Measure attendance across keynotes, panels, workshops, demonstrations, and breakout sessions.
- Live Polling – Review how many delegates participate in polls, voting, quizzes, or other interactive activities.
- Audience Questions – Measure questions submitted through physical or digital Q&A systems.
- Session Ratings – Ask participants to evaluate individual presentations or programme elements.
- Networking Activity – Review meeting requests, scheduled meetings, matchmaking activity, or other relevant networking indicators.
- Event App Activity – Track suitable interactions with agendas, speaker profiles, notifications, bookmarks, surveys, and other functions.
- Content Downloads – Measure access to presentations, reports, brochures, research, and other resources.
- Exhibitor Interactions – Review relevant engagement with exhibition booths, demonstrations, QR codes, or digital profiles.
- Online Engagement – For hybrid events, include questions, polls, chat activity, viewing behaviour, and other relevant virtual interactions.
Audience engagement metrics provide a deeper understanding of how delegates participated, what they interacted with, and which aspects of the event generated meaningful interest.
6.4 Lead Generation
For many corporate conferences, exhibitions, product launches, networking events, and trade shows, lead generation is an important business objective. Measurement should focus not only on the number of contacts collected but also on their relevance and progression after the event.
- Total Leads Captured – Record prospects generated through booths, meetings, demonstrations, networking, QR codes, forms, or approved lead-capture systems.
- Qualified Leads – Identify prospects that meet agreed business criteria.
- Lead Source – Determine whether opportunities originated from exhibitions, sessions, networking, sponsorship activities, meetings, or other interactions.
- Product Interest – Record relevant products or services that prospects expressed interest in.
- Meetings Generated – Track follow-up meetings scheduled during or after the event.
- Sales Opportunities – Identify leads that progress into genuine commercial opportunities.
- Pipeline Value – Where appropriate, estimate the value of event-generated opportunities while distinguishing pipeline from actual revenue.
- Conversions – Track leads that eventually become customers or complete another defined business action.
- Follow-Up Performance – Measure how quickly and consistently event leads are contacted after the event.
Lead-generation measurement should move beyond counting contacts to examining lead quality, follow-up, meetings, opportunities, pipeline development, and eventual conversions.
6.5 Sponsor and Exhibitor Performance
Sponsors and exhibitors often invest in events to achieve specific objectives such as brand exposure, lead generation, customer engagement, product demonstrations, networking, or thought leadership. Their performance should therefore be evaluated using measurements connected to those agreed objectives.
- Booth Interactions – Measure appropriate visits, conversations, demonstrations, or other stand engagement.
- Leads Captured – Record relevant contacts generated through exhibition activities.
- Qualified Leads – Distinguish commercially relevant prospects from general interactions.
- Sponsored Session Attendance – Measure participation in sponsored workshops, presentations, panels, or demonstrations.
- Digital Content Engagement – Track interactions with sponsor profiles, videos, downloads, QR codes, or other materials.
- Brand Visibility – Document agreed exposure through LED screens, stage branding, websites, programmes, livestreams, signage, or event apps.
- Networking Meetings – Track relevant meetings between sponsors, exhibitors, delegates, and potential customers.
- Product Demonstrations – Measure participation in demonstrations or experience areas.
- Sponsor Feedback – Ask participating organizations whether agreed objectives and expectations were achieved.
Sponsor and exhibitor measurement can provide evidence of visibility, interactions, leads, meetings, content engagement, product interest, and other agreed outcomes, supporting more transparent post-event reporting.
6.6 Delegate Satisfaction
Quantitative performance data should be complemented by feedback showing how participants actually experienced the event. Delegate satisfaction can reveal strengths and weaknesses that attendance or engagement statistics may not explain.
- Overall Satisfaction – Ask delegates to evaluate their complete event experience.
- Content Quality – Measure whether presentations and discussions were relevant and useful.
- Speaker Feedback – Assess speaker expertise, communication, and presentation value.
- Venue Experience – Review accessibility, comfort, location, facilities, room layouts, and other venue factors.
- Registration Experience – Evaluate pre-event registration and on-site check-in.
- Networking Experience – Determine whether delegates had useful opportunities to build professional relationships.
- Catering Feedback – Assess food, beverages, service, dietary options, and meal arrangements.
- Audiovisual Experience – Gather feedback about sound clarity, screen visibility, lighting, presentations, livestreaming, and hybrid participation.
- Open-Ended Feedback – Allow delegates to identify issues or positive experiences not captured by structured questions.
- Future Participation Intent – Where relevant, ask whether participants are interested in attending future editions.
Delegate feedback helps explain how attendees experienced the content, speakers, venue, networking, catering, technology, and overall event, providing important context for numerical performance indicators.
6.7 Content Performance
Event content can continue generating value after delegates leave the venue. Presentations, livestreams, recordings, interviews, photographs, highlight videos, speaker clips, and educational resources can extend the useful life of an event.
- Livestream Views – Measure relevant live online audiences according to platform definitions.
- Viewing Duration – Review how long audiences watch livestreamed or recorded content where reliable data is available.
- Recorded Session Views – Track continued viewing after the event.
- Presentation Downloads – Measure access to slides, reports, research, and other resources.
- Speaker Video Performance – Compare engagement with individual speaker or session recordings.
- Highlight Video Views – Monitor engagement with post-event recap content.
- Social Media Clips – Measure appropriate views, shares, comments, and other interactions with short-form event content.
- Website Engagement – Review traffic to post-event resources, event reports, recordings, and related pages.
- Content Longevity – Track whether useful event materials continue attracting audiences weeks or months after the event.
- Lead Generation from Content – Where appropriate, measure whether post-event resources generate inquiries, registrations, downloads, or other business actions.
Content-performance measurement shows whether an event continues creating value through livestreams, recordings, presentations, downloads, social content, educational resources, and post-event engagement.
6.8 Event Return on Investment
Event ROI attempts to compare relevant event investment with measurable outcomes. The appropriate method depends on the event’s objectives because not every valuable result can be expressed immediately as revenue
- Total Event Costs – Include relevant venue, catering, production, marketing, staffing, travel, technology, logistics, and other expenses.
- Direct Revenue – Measure ticket sales, sponsorship revenue, exhibitor fees, or other directly attributable event income where applicable.
- Event-Generated Sales – Track revenue that can reasonably be connected to event-generated leads or opportunities.
- Qualified Pipeline – Measure relevant opportunities created by the event while keeping pipeline value separate from confirmed revenue.
- Customer Outcomes – Events may contribute to retention, account development, product adoption, or stronger customer relationships.
- Lead Generation – Compare the quantity and quality of business opportunities with the resources invested.
- Sponsor Value – Review whether sponsorship commitments delivered the agreed exposure, engagement, or lead opportunities.
- Strategic Outcomes – Some events aim to achieve education, stakeholder engagement, employee alignment, partnerships, brand awareness, or knowledge sharing rather than direct revenue.
- Cost Efficiency – Compare relevant metrics such as cost per attendee, cost per qualified lead, or cost per engagement where useful.
- Longer-Term Measurement – Some commercial outcomes may appear weeks or months after the event and require continued tracking.
For events where financial returns can reasonably be attributed, a basic financial ROI calculation may be expressed as:
Event ROI (%) = (Financial Return Attributed to the Event − Relevant Event Cost) ÷ Relevant Event Cost × 100
The calculation is most useful when organizations clearly define what counts as event cost and attributable financial return rather than combining unrelated business results.
Event ROI should connect costs with relevant financial and strategic outcomes while distinguishing confirmed revenue from pipeline, estimated value, engagement metrics, and longer-term benefits.
Event performance should be measured against the event’s original objectives using relevant KPIs rather than relying only on attendance numbers or general impressions.
A comprehensive measurement framework can combine registration conversion, attendance, audience engagement, lead generation, sponsor and exhibitor outcomes, delegate satisfaction, content performance, operational information, and financial results. Different events will require different KPIs: a product launch may emphasize qualified leads and sales opportunities, while a professional conference may focus more heavily on participation, learning, networking, satisfaction, and content engagement.
ROI should also be interpreted carefully. Revenue, qualified pipeline, brand exposure, knowledge transfer, customer relationships, partnerships, employee engagement, and sponsor value are different types of outcomes and should not automatically be treated as equivalent financial returns.
By defining objectives before the event, selecting appropriate KPIs, collecting reliable information, and continuing measurement after the event where necessary, organizers can understand what worked, what generated value, where resources were used effectively, and what should be improved for future events.
7. How Peak Audio Supports Data-Driven Events

Data-Driven Event Planning Strategies
Data-driven events depend not only on analytics platforms and registration systems but also on reliable audiovisual and digital production infrastructure that enables audiences to see, hear, interact with, and access event content effectively. Professional sound, LED screens, interactive presentations, livestreaming, hybrid technology, simultaneous interpretation, video production, and technical support can all contribute to the environments in which useful event engagement data is generated.
For corporate conferences, exhibitions, AGMs, product launches, workshops, summits, networking events, executive meetings, trade shows, and MICE events, Peak Audio can support the technical production required for professional presentations, interactive audience participation, digital content creation, remote participation, and post-event analysis.
7.1 Professional Conference Sound Systems
Reliable audio is fundamental to data-driven conferences because delegates need to hear presentations, discussions, questions, and responses clearly before meaningful participation can take place. Poor sound can affect audience experience and reduce the usefulness of recordings, livestreams, Q&A sessions, and other event content.
- Professional Speaker Systems – Appropriate sound systems can provide clear and consistent audio coverage across conference spaces.
- Wireless Microphones – Handheld, lapel, and headset microphones can support speakers, moderators, panelists, and audience interaction.
- Panel Discussion Audio – Multiple microphone systems can support structured discussions involving several speakers.
- Audience Q&A – Roving microphones can allow delegates to participate in physical question-and-answer sessions.
- Digital Mixing Consoles – Professional audio mixing provides centralized control over microphones, playback sources, presentations, and other sound inputs.
- Breakout Room Audio – Different conference rooms can receive appropriately sized audio systems based on audience and programme requirements.
- Hybrid Audio Integration – Physical speakers and remote participants can be integrated into the same discussion.
- Recording Audio – Clean audio feeds can support conference recordings, interviews, livestreams, and post-event video production.
- Technical Monitoring – On-site technicians can monitor audio throughout the programme and respond to issues.
Professional conference sound creates the foundation for clear presentations, audience Q&A, panel discussions, hybrid participation, recordings, and livestreaming, helping delegates engage effectively with event content.
7.2 LED Screens and Digital Displays
LED screens and digital displays provide flexible platforms for presenting information throughout an event. Beyond presentation slides, screens can display polling results, event schedules, speaker information, sponsor content, audience questions, live camera feeds, dashboards, and other dynamic information.
- Presentation Content – Display slides, charts, graphs, videos, demonstrations, and other speaker materials.
- Live Poll Results – Audience responses can be displayed during interactive sessions where compatible polling platforms are used.
- Digital Q&A Content – Selected audience questions can be displayed for speakers and delegates.
- Event Schedules – Screens can communicate agendas, session changes, announcements, and programme information.
- Speaker Information – Display names, titles, organizations, topics, and other relevant speaker details.
- Live Camera Feeds – Large audiences can view close-up images of speakers, panels, demonstrations, and presentations.
- Sponsor Visibility – Digital displays can present approved sponsor logos, videos, messages, and branded content.
- Data Visualization – Suitable charts, statistics, survey results, and other event information can be displayed visually.
- Real-Time Updates – Digital content can be changed without replacing physical signage.
LED screens and digital displays support data-driven events by creating a flexible visual platform for presentations, live results, digital Q&A, event information, data visualization, sponsor content, and real-time communication.
7.3 Live Polling and Interactive Presentation Integration
Interactive presentation technology can help turn traditional presentations into two-way conversations. Peak Audio’s audiovisual production can provide the screens, projection infrastructure, sound systems, presentation management, internet coordination, and technical integration required to display outputs from compatible audience-engagement platforms.
- Live Poll Display – Polling results can be integrated into presentation screens where the selected platform supports this functionality.
- Audience Voting – Interactive systems can support suitable voting, quizzes, surveys, or opinion questions.
- Digital Q&A – Questions submitted through compatible platforms can be incorporated into moderated discussions.
- QR-Code Participation – Delegates may access suitable polling or engagement platforms using smartphones.
- Real-Time Results – Audience responses can be displayed immediately during presentations.
- Word Clouds – Compatible engagement platforms may visualize frequently submitted words or themes.
- Knowledge Checks – Training sessions can use interactive questions to assess audience understanding.
- Panel Interaction – Moderators can incorporate polling results or audience questions into panel discussions.
- Hybrid Participation – Where the selected platform allows it, physical and remote audiences can participate in the same interactive activities.
Live polling and interactive presentation integration can help organizers create measurable audience participation, immediate feedback, interactive Q&A, voting, knowledge checks, and more responsive conference sessions.
7.4 Live Streaming and Hybrid Event Technology
Live streaming and hybrid production allow organizations to extend events beyond the physical venue. Remote delegates, international speakers, executives, partners, and other participants can connect to suitable event platforms while professional production supports the physical conference.
- Professional Livestreaming – Conference sessions can be distributed to approved online audiences.
- Remote Speakers – Presenters can contribute from other cities, countries, or regions.
- Virtual Delegates – Online audiences can participate without being physically present at the venue.
- Hybrid Panel Discussions – Physical and remote speakers can be integrated into shared discussions.
- Presentation Integration – Slides, videos, speakers, and other visual sources can be incorporated into the livestream.
- Remote Q&A – Online participants can submit questions through appropriate digital platforms.
- Multi-Platform Production – Depending on event requirements and platform capabilities, content can be prepared for suitable streaming destinations.
- Online Audience Measurement – Streaming platforms may provide metrics such as viewers, viewing duration, geographic reach, and engagement.
- Recorded Sessions – Livestreamed programmes can also be recorded where appropriate for later viewing and analysis.
Live streaming and hybrid event technology can expand participation while generating additional information about online audiences, viewing behaviour, remote engagement, content performance, and digital reach where supported by the chosen platforms.
7.5 Multi-Camera Video Production and Recording
Professional video production allows event content to continue creating value after the physical programme has ended. Multi-camera coverage can capture speakers, audiences, presentations, panels, demonstrations, and other important event moments.
- Multi-Camera Coverage – Different camera positions can capture speakers, panelists, audiences, and wider stage views.
- Speaker Recording – Individual keynote presentations and educational sessions can be recorded.
- Panel Discussions – Multi-camera switching can capture interactions between moderators and panelists.
- Presentation Capture – Speaker video can be combined with slides and other presentation content.
- Audience Interaction – Questions, reactions, and other relevant audience participation can be captured.
- Interview Production – Speakers, sponsors, exhibitors, executives, and delegates can be interviewed during the event.
- Livestream Production – Camera feeds can support professional live broadcasts.
- Session Archives – Recorded sessions can become an organized library of event content.
- Post-Event Analysis – Recordings can help teams review presentations, audience interaction, production, and programme delivery.
- Future Content Creation – Recorded material can be repurposed into appropriate highlights, interviews, educational videos, and promotional content.
Multi-camera production transforms live event activity into recorded digital assets that can support livestreaming, post-event analysis, content distribution, marketing, training, and future event promotion.
7.6 Simultaneous Interpretation Systems
For international and multilingual conferences, interpretation systems can help ensure that language differences do not prevent delegates from understanding and participating in event content.
- Interpreter Audio Systems – Professional infrastructure can route speaker audio to interpreters and interpreted audio to delegates.
- Interpretation Booths – Appropriate booth arrangements can provide interpreters with a suitable working environment.
- Delegate Receivers – Participants can receive interpreted audio through suitable receivers and headsets.
- Multiple Languages – Depending on system design and event requirements, different language channels can be supported.
- Conference Integration – Interpretation systems can work alongside microphones, sound systems, presentations, and other conference technology.
- Hybrid Integration – Where technically appropriate, interpretation can be incorporated into hybrid or online participation workflows.
- International Conferences – Interpretation supports participation by delegates from different linguistic backgrounds.
- Inclusive Communication – Providing suitable language access can enable more delegates to understand discussions and contribute meaningfully.
- Technical Monitoring – Professional support can help maintain reliable interpretation audio throughout the event.
Simultaneous interpretation systems can help international conferences provide more accessible multilingual communication, enabling wider participation in presentations, discussions, Q&A, and other event activities.
7.7 Digital Content Production for Post-Event Analysis
Data-driven events should not necessarily stop generating value when the venue closes. Professionally produced event content can support performance analysis, knowledge sharing, marketing, training, stakeholder communication, and future event planning.
- Full Session Recordings – Preserve presentations, panels, workshops, and keynote sessions.
- Speaker Videos – Individual presentations can be prepared for suitable digital distribution.
- Event Highlight Videos – Important moments can be condensed into shorter recap content.
- Speaker Interviews – Additional expert insights can extend the educational value of the event.
- Sponsor Content – Approved sponsor interviews, demonstrations, or branded segments can support post-event reporting.
- Social Media Clips – Longer event recordings can be repurposed into suitable short-form content.
- Training Resources – Educational presentations can become internal or external learning materials where appropriate.
- Content Performance Tracking – Once distributed through measurable platforms, organizers can monitor relevant views, viewing duration, downloads, or engagement.
- Programme Analysis – Organizers can review recordings alongside session attendance, ratings, questions, and feedback.
- Extended Event Lifecycle – Valuable content can continue reaching audiences after the physical programme ends.
Digital content production extends the measurable life of an event by transforming presentations, discussions, interviews, and event activity into recordings, educational resources, marketing content, and digital assets whose performance can continue to be evaluated after the event.
7.8 Professional Technical Production and On-Site Support
Data-driven event technology is most useful when the underlying production infrastructure works reliably. Professional technical planning helps connect sound, screens, cameras, presentations, livestreaming, remote speakers, interpretation, interactive platforms, recording, lighting, and venue infrastructure into a coordinated production environment.
- Pre-Event Site Surveys – Assess room dimensions, power, internet connectivity, stage requirements, camera positions, sound coverage, and screen visibility.
- Technical System Design – Specify equipment according to audience size, venue layout, programme structure, and digital requirements.
- Equipment Installation – Set up sound, LED screens, lighting, staging, cameras, interpretation, and other production systems.
- System Testing – Test microphones, presentations, video playback, livestreaming, internet connections, interpretation, and other critical systems before the programme.
- Speaker Technical Support – Assist presenters with microphones, presentations, videos, remote connections, and stage requirements.
- Presentation Management – Coordinate slides, videos, speaker content, digital graphics, and screen outputs.
- Live Technical Operation – Operate sound, screens, cameras, lighting, livestreaming, recording, and related systems throughout the event.
- Technical Monitoring – Monitor production systems and identify problems before they significantly affect programme delivery.
- Troubleshooting – Respond to microphone, presentation, display, connectivity, streaming, or other technical issues.
- Production Coordination – Work with organizers, venues, speakers, event managers, livestream teams, and other suppliers to coordinate technical delivery.
- Backup Planning – Where appropriate, prepare practical contingencies for critical technical components.
Professional technical support connects the different technologies used in a data-driven event and helps ensure that presentations, audience interaction, livestreaming, recording, interpretation, displays, and digital participation operate reliably throughout the programme.
Peak Audio supports data-driven events by providing the audiovisual and digital production infrastructure required for professional presentations, interactive sessions, livestreaming, hybrid participation, video recording, digital content creation, and measurable audience engagement.
Professional sound systems enable speakers and audiences to communicate clearly, while LED screens can display presentations, live polls, digital Q&A, event information, sponsor content, and visualized results. Interactive presentation integration can support audience participation, while livestreaming and hybrid technology can extend events to remote delegates and provide additional digital engagement information.
Multi-camera video production, simultaneous interpretation, and post-event content production can further extend the reach and useful life of event content. Combined with professional technical planning, installation, testing, live operation, monitoring, troubleshooting, and production coordination, these capabilities can provide the technical foundation required for modern data-driven conferences and corporate events in Kenya.
8. Frequently Asked Questions About Data-Driven Event Planning Strategies
Data-driven event planning can involve information collected throughout the event lifecycle—from registration and marketing to attendance, audience engagement, networking, livestreaming, surveys, lead generation, content performance, and post-event reporting. The following FAQs explain how organizers can use this information to improve decision-making and how Peak Audio can support the audiovisual and technical production requirements of modern data-driven corporate events in Kenya.
8.1 What is data-driven event planning?
Data-driven event planning is the practice of using relevant information, measurable evidence, and event analytics to support decisions before, during, and after an event instead of relying mainly on assumptions.
The information may come from:
- Registration systems – Delegate numbers, registration timing, categories, and preferences.
- Marketing platforms – Website traffic, email activity, advertising, social media, and registrations.
- Attendance systems – Check-ins, session attendance, and arrival patterns.
- Event apps – Agenda views, downloads, bookmarks, networking, and other interactions.
- Audience-engagement tools – Polls, surveys, questions, voting, and feedback.
- Livestreaming platforms – Online audiences, viewing duration, and other available engagement metrics.
- Networking platforms – Meeting requests, matchmaking, and professional connections.
- Post-event surveys – Satisfaction, speaker ratings, content feedback, and suggestions.
- Business systems – Leads, sales opportunities, sponsorship outcomes, and other relevant results.
Organizers can then use these insights to improve venues, budgets, marketing, agendas, catering, delegate communication, technical production, sponsorship, and future events.
Data-driven event planning turns relevant event information into practical evidence for better planning, live decision-making, performance measurement, and continuous improvement.
8.2 Why is data important in event planning?
Event organizers make numerous decisions involving attendance, budgets, venues, speakers, catering, marketing, technology, staffing, logistics, and delegate experiences. Data can provide stronger evidence for these decisions
Data can help organizers:
- Forecast Attendance – Estimate likely delegate numbers using registration and historical attendance patterns.
- Select Appropriate Venues – Match expected audiences with suitable venue capacity and facilities.
- Improve Budgets – Use previous expenditure and attendance information for more realistic forecasting.
- Improve Marketing – Identify channels and campaigns contributing to registrations.
- Design Better Agendas – Understand which speakers, topics, and session formats generate interest.
- Improve Catering – Estimate realistic meal quantities and dietary requirements.
- Plan Event Technology – Determine appropriate sound, screens, livestreaming, recording, and other technical requirements.
- Measure Performance – Compare actual results with predefined objectives and KPIs.
- Improve Future Events – Apply lessons from previous event performance.
Mini Conclusion
Data helps event organizers replace unnecessary guesswork with evidence-based planning, measurement, and continuous improvement.
8.3 What data should event organizers collect?
The right information depends on the event’s objectives. Organizers should focus on information that supports specific decisions rather than collecting data simply because technology makes it possible.
Useful categories can include:
- Registration Data – Registrations, timing, sources, categories, and preferences.
- Delegate Information – Relevant industry, organization, role, location, and professional interests.
- Marketing Data – Website traffic, campaign performance, email activity, advertising, and conversions.
- Attendance Data – Check-ins, no-shows, arrival patterns, and session participation.
- Engagement Data – Polls, questions, session ratings, app interactions, and downloads.
- Networking Data – Meetings, matchmaking activity, and relevant professional connections.
- Sponsor and Exhibitor Data – Leads, booth interactions, content engagement, and agreed visibility measures.
- Livestream Data – Viewers, viewing duration, geographic reach, and other platform-provided metrics.
- Feedback Data – Surveys, comments, ratings, and suggestions.
- Business Outcomes – Leads, opportunities, sales, partnerships, or other relevant results.
Personal information should be collected for a clear and legitimate purpose and handled responsibly with appropriate privacy, consent, access, and security practices.
Event organizers should collect relevant, reliable, and actionable information connected to clearly defined event objectives and planning decisions.
8.4 What are the most important event KPIs?
There is no single set of KPIs that is equally important for every event. Appropriate measures depend on whether the event aims to generate leads, educate delegates, build relationships, engage employees, promote products, deliver sponsor value, or achieve another objective.
Common event KPIs include:
- Registration Numbers
- Registration Conversion Rate
- Attendance Rate
- No-Show Rate
- Session Attendance
- Audience Engagement
- Poll and Q&A Participation
- Networking Activity
- Qualified Leads
- Sponsor and Exhibitor Engagement
- Delegate Satisfaction
- Content Engagement
- Livestream Performance
- Cost per Attendee or Qualified Lead
- Relevant Financial and Strategic Outcomes
For example, a trade show may emphasize qualified leads and exhibitor interactions, while an educational conference may place greater emphasis on session participation, learning, feedback, and delegate satisfaction.
The most useful KPIs are those that directly measure progress toward the event’s original objectives rather than metrics selected simply because they are easy to collect.
8.5 How can data improve the attendee experience?
Data can help organizers understand what delegates need, which content they value, how they interact with the programme, and where operational improvements may be necessary.
It can support:
- Personalized Agendas – Recommend sessions based on interests and professional roles.
- Relevant Communication – Send appropriate schedules, reminders, instructions, and programme updates.
- Better Networking – Connect participants according to professional interests or business objectives.
- Improved Content – Use previous feedback and engagement to select relevant topics.
- Better Room Allocation – Assign popular sessions to appropriately sized spaces.
- Shorter Registration Queues – Use arrival information to improve check-in operations.
- Improved Catering – Plan quantities and dietary requirements more accurately.
- Hybrid Participation – Provide appropriate experiences for physical and remote audiences.
- Faster Problem Resolution – Use real-time operational information to identify issues affecting delegates.
Data can improve attendee experience by making events more relevant, personalized, responsive, accessible, and operationally efficient.
8.6 How can event organizers use real-time data?
Real-time data allows organizers to understand what is happening during an event and respond where appropriate.
Organizers can monitor:
- Digital Check-In – Compare actual attendance with registrations.
- Registration Queues – Identify congestion and adjust check-in resources.
- Session Attendance – Identify high-demand or under-attended sessions.
- Room Occupancy – Monitor capacity and delegate movement.
- Live Polling – Gather immediate audience opinions.
- Digital Q&A – Identify recurring questions and areas of interest.
- Event App Activity – Monitor programme, content, and networking interactions.
- Livestream Performance – Review online audiences and platform-provided engagement metrics.
- Technical Performance – Identify problems involving sound, screens, presentations, connectivity, or livestreaming.
- Catering Demand – Monitor consumption and replenishment requirements.
Real-time data can support faster decisions involving delegate management, room allocation, content, communication, technical production, catering, and overall event operations.
8.7 How is AI used in data-driven event planning?
Artificial intelligence can help analyze larger volumes of event information, identify patterns, automate repetitive analytical work, and support personalization and forecasting.
AI-assisted tools may support:
- Delegate Segmentation – Organize audiences according to relevant characteristics or behaviour.
- Session Recommendations – Suggest potentially relevant programme content.
- Networking Matchmaking – Recommend professional connections based on agreed information.
- Attendance Forecasting – Analyze historical and current registration patterns.
- Session Demand Prediction – Identify programme sessions that may attract larger audiences.
- Survey Analysis – Organize large quantities of open-text feedback.
- Sentiment Analysis – Identify recurring positive or negative themes, subject to human verification.
- Pattern Detection – Identify relationships across attendance, engagement, marketing, and operational information.
- Automated Reporting – Consolidate information into dashboards and structured reports.
AI outputs should still be reviewed by event professionals because predictions and automated classifications can be incomplete or inaccurate.
AI can help transform large event datasets into patterns, recommendations, forecasts, and reports, but professional judgment remains important when interpreting and acting on those outputs.
8.8 How can event organizers measure audience engagement?
Audience engagement should be measured using multiple indicators rather than relying on a single metric.
Useful engagement indicators can include:
- Session Attendance – Number of delegates participating in different sessions.
- Poll Participation – Responses to live questions, surveys, quizzes, or voting.
- Audience Questions – Number and type of questions submitted.
- Session Ratings – Delegate evaluations of presentations and speakers.
- Event App Interactions – Agenda views, bookmarks, notifications, and other suitable activity.
- Content Downloads – Access to presentations, reports, brochures, and other resources.
- Networking Activity – Meetings, connections, or matchmaking participation.
- Exhibitor Engagement – Relevant booth visits, demonstrations, and lead interactions.
- Livestream Engagement – Viewing duration, online questions, polls, and other platform-supported interactions.
- Post-Event Content Engagement – Continued viewing, downloading, or sharing of event materials.
Combining physical participation, digital interactions, networking, content consumption, and feedback provides a more complete picture of audience engagement.
8.9 How do you calculate event ROI?
Event ROI compares relevant investment with measurable outcomes. For events where financial returns can reasonably be attributed, a basic calculation is:
Event ROI (%) = (Financial Return Attributed to the Event − Relevant Event Cost) ÷ Relevant Event Cost × 100
For example, if an organization spends KES 2,000,000 on an event and can reasonably attribute KES 3,000,000 in financial return to it:
ROI = (KES 3,000,000 − KES 2,000,000) ÷ KES 2,000,000 × 100 = 50%
However, not every event is designed primarily to generate immediate revenue. Organizers may also need to measure:
- Qualified Leads
- Sales Pipeline
- Customer Engagement
- Sponsor Value
- Partnerships
- Employee Engagement
- Knowledge Transfer
- Brand Awareness
- Delegate Satisfaction
- Content Performance
These strategic outcomes should be reported clearly rather than automatically assigning them an unsupported monetary value.
Event ROI is most meaningful when organizers define event costs, attributable financial returns, strategic objectives, and measurement methods before the event begins.
8.10 Does Peak Audio support data-driven corporate events?
Yes. Peak Audio can support the audiovisual and digital production infrastructure required for modern data-driven corporate events in Kenya.
Support can include:
- Professional conference sound systems
- LED screens and digital displays
- Stage and set production
- Professional event lighting
- Interactive presentation integration
- Livestreaming and hybrid event technology
- Multi-camera video production
- Conference recording
- Simultaneous interpretation systems
- Presentation management
- Technical planning and site surveys
- On-site technical support
These services provide the production environment required for professional presentations, audience interaction, hybrid participation, digital content creation, and other technology-driven event experiences.
Peak Audio can provide the audiovisual, video, hybrid, interpretation, display, and technical production infrastructure required to support professionally delivered data-driven events.
8.11 Can Peak Audio provide livestreaming, interactive presentations and video production?
Yes. Peak Audio can support events requiring livestreaming, hybrid participation, interactive presentation integration, professional video production, and event recording.
Services can include:
- Professional Livestreaming – Broadcast conference sessions to approved online audiences.
- Hybrid Event Production – Connect physical venues with remote speakers and delegates.
- Interactive Presentations – Integrate compatible polling, Q&A, presentation, and audience-engagement tools with event displays.
- Multi-Camera Production – Capture speakers, panel discussions, audiences, and presentations from multiple camera positions.
- Professional Recording – Record keynote sessions, workshops, interviews, panels, and other programme content.
- LED Screen Integration – Display presentations, live camera feeds, poll results, speaker information, and digital content.
- Remote Speaker Integration – Bring external presenters into physical conference programmes.
- Post-Event Video Production – Create suitable recordings, highlights, interviews, social clips, and other digital content.
Combining livestreaming, interactive presentations, LED screens, professional sound, and multi-camera video production can create a connected physical and digital event environment while producing useful content for post-event distribution and analysis.
8.12 How can I get a quotation for technology-driven event production in Kenya?
To obtain an accurate quotation from Peak Audio, provide as much information as possible about the planned event so that the technical requirements can be matched to the venue, audience, programme, and production objectives.
Useful information includes:
- Event Type – Conference, AGM, summit, exhibition, product launch, workshop, gala, or other format.
- Event Date – Including setup, rehearsal, event, and dismantling dates where relevant.
- Venue and Location – The selected venue or proposed location in Kenya.
- Expected Attendance – Approximate number of physical and virtual delegates.
- Programme Format – Keynotes, panels, workshops, entertainment, demonstrations, or breakout sessions.
- Sound Requirements – Speakers, microphones, audience Q&A, panels, and playback requirements.
- LED Screen Requirements – Screen size, content, stage layout, and viewing requirements.
- Livestreaming Requirements – Expected online audiences, platforms, and remote participants.
- Video Production – Recording, multi-camera production, interviews, highlights, or post-event content.
- Interpretation Requirements – Languages, delegate numbers, and conference format.
- Interactive Requirements – Polling, Q&A, voting, or other audience-engagement technology.
- Stage and Lighting Requirements – Stage design, branding, lighting, and presentation requirements.
- Technical Support – Setup, rehearsals, live operation, monitoring, and on-site support.
Providing a detailed event brief allows the technical team to recommend an appropriate production setup rather than supplying a generic equipment package.
For a technology-driven event in Kenya, share your event date, venue, expected audience, programme, audiovisual requirements, livestreaming needs, video-production requirements, and interactive technology needs with Peak Audio so that an appropriate technical production quotation can be prepared.
Data-driven event planning combines clear objectives, relevant KPIs, reliable data collection, real-time monitoring, audience engagement, analytics, AI-assisted insights, performance measurement, and post-event reporting to support better event decisions.
Organizers can use information before an event to improve venue selection, budgets, attendance forecasting, marketing, agendas, catering, communication, and audiovisual planning. During the event, real-time information can support decisions involving check-in, session attendance, audience interaction, room occupancy, livestreaming, technical production, and operations. Afterward, organizers can measure attendance, engagement, leads, sponsor performance, delegate satisfaction, content performance, financial outcomes, and lessons for future events.
Peak Audio can support this approach by providing professional sound systems, LED screens, interactive presentation integration, livestreaming and hybrid technology, multi-camera video production, simultaneous interpretation, digital content production, and on-site technical support for modern corporate conferences and technology-driven events across Kenya.
The Future of Data-Driven Event Planning
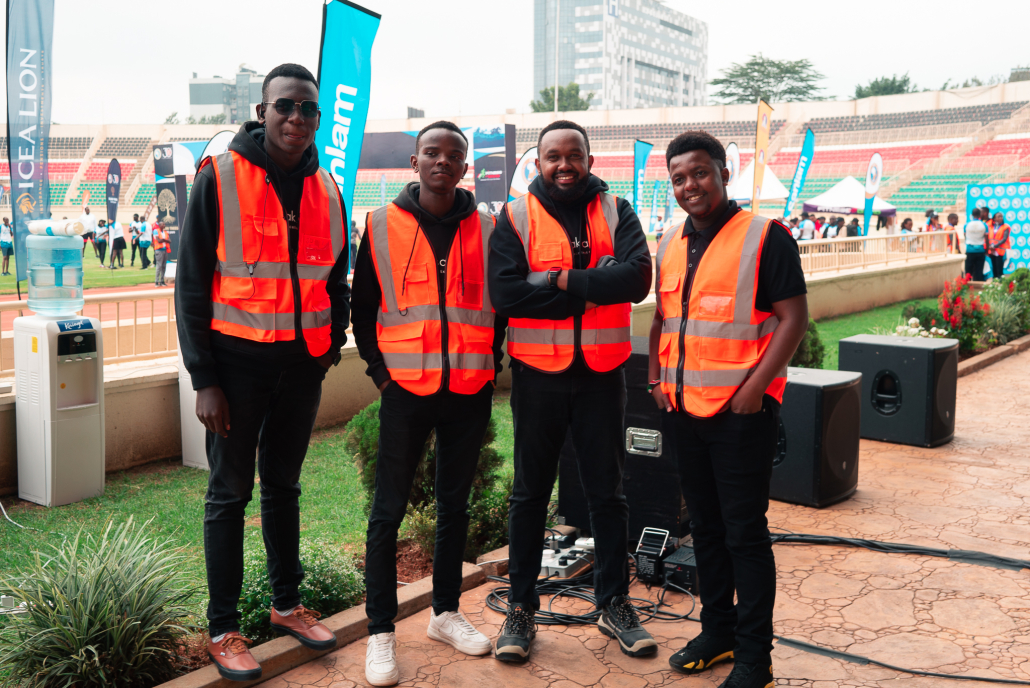
Data-Driven Event Planning Strategies
Data-driven event planning involves using registration data, audience demographics, marketing analytics, attendance information, engagement metrics, networking activity, sponsor performance, delegate feedback, content analytics, and business outcomes to make more informed decisions. Rather than relying primarily on assumptions, organizers can use measurable information to understand their audiences, improve event design, allocate resources more effectively, evaluate performance, and identify opportunities for future events.
Data can support the entire event lifecycle, from initial planning and marketing to registration, live event management, technical production, post-event analysis, and future event optimization. However, effective measurement should begin with clear event objectives and relevant KPIs so that organizers collect information that directly supports their business and event goals. Combining these measurements with AI, event platforms, digital registration, live polling, livestreaming, audience engagement technology, and structured post-event reporting can provide deeper insights into delegate behaviour, engagement, content performance, event ROI, and overall event value.
At Peak Audio, we support modern data-driven corporate events with professional sound systems, LED screens, staging, lighting, simultaneous interpretation, livestreaming, hybrid event technology, video production, interactive presentation support, and experienced technical assistance. By combining reliable event production with digital and audience engagement technologies, organizations can create more interactive experiences, capture meaningful event information, demonstrate measurable outcomes, and use those insights to continuously improve future conferences, exhibitions, AGMs, summits, and corporate events.
Leave a Reply
Want to join the discussion?Feel free to contribute!